Local NEXRAD Radar
- Current Radar
- Radar Summary
- Yesterdays Radar Loop
The Authority in Expert Weather is now here on Weather Underground
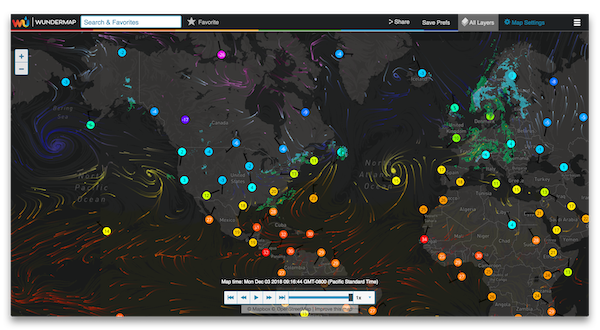
View All MapsStarting January 17, 2019, we began redirecting traffic from Intellicast.com to wunderground.com. Even though the Intellicast name and website will be going away, the technology and features that you have come to rely on will continue to live on wunderground.com. Read more about this change.
Maps are categorized in a new but familiar way.